


What Is a Good Click-Through Rate for Google Ads? Industry Benchmarks and the CTR Trap Most Advertisers Fall Into
A good click-through rate for Google Search Ads is 3–5% for most industries, with top-performing accounts consistently hitting 6–8% on branded keywords and 4–6% on high-intent non-branded terms. But here’s the part most benchmark articles skip: your CTR is a vanity metric until you connect it to your conversion rate and cost-per-acquisition. I’ve audited accounts with 8% CTRs that were bleeding money and accounts with 1.5% CTRs that were generating 12x ROI. The number matters less than what the number means for your specific business.
The 3.17% Average Everyone Cites — And Why It’s Almost Useless
Open any “Google Ads CTR benchmark” article and you’ll find the same stat in the first paragraph: the average CTR across all industries is 3.17% on the Search Network. This number comes from WordStream’s aggregated data and it’s technically accurate. It’s also practically meaningless for your campaign.
Here’s why. That 3.17% average lumps together dating services (6.28% CTR), legal (6.5% CTR), e-commerce (2.1% CTR), and B2B technology (2.4% CTR). Telling an e-commerce advertiser that their 2.5% CTR is “below average” because the cross-industry mean is 3.17% is like telling a marathon runner they’re slow because the average human runs a 12-minute mile. The comparison group is wrong.
Your CTR is determined by three variables the 3.17% average ignores entirely:
- Your industry’s search intent profile. Emergency services (plumbing, locksmith) generate high-CTR searches because the user needs help right now. B2B software generates low-CTR searches because the user is researching, not buying.
- Your keyword match type distribution. Broad match keywords generate more impressions from loosely related queries, which dilutes CTR. Exact match keywords generate fewer impressions from highly relevant queries, which inflates CTR.
- Your ad position. Ads in positions 1–2 average 6–8% CTR. Ads in positions 3–4 average 2–3% CTR. Ads below the fold average under 1%. If you’re comparing your position-3 CTR to a competitor’s position-1 CTR, you’re not measuring ad quality — you’re measuring auction economics.
The only benchmark that matters is your CTR relative to your industry, your ad position, and your own historical performance. Everything else is noise.
What Is a Good CTR for Google Ads by Industry (2024 Benchmarks)
Here are the actual Google Ads performance benchmarks by industry, based on aggregated 2023–2024 Search Network data. Find your row and compare your CTR against the “Good” column, not the “Average” column.
| Industry | Average CTR | Good CTR | Excellent CTR | Why It Varies |
|---|---|---|---|---|
| Legal | 6.5% | 7–9% | 10%+ | High urgency, high CPC, strong commercial intent |
| Dating & Personals | 6.3% | 7–8% | 9%+ | Emotional intent, curiosity-driven clicks |
| Home Services (HVAC, Plumbing) | 5.8% | 6–8% | 9%+ | Emergency searches, local intent, limited results |
| Real Estate | 3.7% | 4–6% | 7%+ | Research-heavy, long sales cycle, comparison shopping |
| Healthcare & Medical | 3.5% | 4–6% | 7%+ | Mixed urgency (emergency vs. elective) |
| Finance & Insurance | 3.4% | 4–5% | 6%+ | Competitive auctions, regulated ad copy |
| Automotive | 3.2% | 4–5% | 6%+ | Research-heavy, local dealer competition |
| B2B Services | 2.6% | 3–4% | 5%+ | Long sales cycle, niche audiences, low search volume |
| Technology & SaaS | 2.4% | 3–4% | 5%+ | Informational searches, comparison shopping |
| E-commerce | 2.1% | 3–4% | 5%+ | Price comparison behavior, Shopping ad competition |
The critical insight: A “good” CTR is roughly 20–30% above your industry average. An “excellent” CTR is 50%+ above average. If you’re in e-commerce and hitting 3.5%, you’re outperforming most of your competitors — even though the cross-industry “average” of 3.17% would suggest you’re merely mediocre.
WordStream Google Ads benchmarks by industry 2024
The CTR vs. Conversion Rate Trap — Why a 10% CTR Can Lose You Money
This is the section that changes how most advertisers think about their campaigns, and it’s the reason I put “CTR trap” in the title of this article.
A high CTR with a low conversion rate is more expensive than a low CTR with a high conversion rate. The math is simple but almost nobody does it.
Consider two campaigns in the same industry with identical $5,000 monthly budgets and $5 average CPCs:
Campaign A (High CTR, Low Conversion):
- CTR: 8%
- Impressions: 12,500
- Clicks: 1,000
- Conversion rate: 1%
- Conversions: 10
- Cost per acquisition: $500
Campaign B (Low CTR, High Conversion):
- CTR: 2.5%
- Impressions: 12,500
- Clicks: 312
- Conversion rate: 8%
- Conversions: 25
- Cost per acquisition: $200
Campaign B has a CTR that would make most advertisers panic. It’s “below average” by almost any benchmark. But it generates 2.5x more conversions at 60% lower CPA because the clicks it does get are from highly qualified searchers who are ready to buy.
Campaign A’s 8% CTR is a liability. It means the ad copy is attracting curiosity clicks from people who aren’t ready to purchase. Every unqualified click costs $5 and converts at 1%. The ad is doing its job too well — it’s clicking, but it’s not filtering.
The metric you should actually track is profit per impression. Multiply your CTR × your conversion rate × your average order value, then subtract your CPC. This single number tells you whether your ad is generating or destroying value, regardless of what the CTR dashboard says.
Search vs. Display vs. YouTube — CTR Benchmarks by Ad Format
One of the most common mistakes I see in account audits is advertisers comparing their Display CTR to Search benchmarks and concluding their Display campaigns are broken. They’re not broken. They’re a fundamentally different ad format serving a fundamentally different purpose.
| Ad Format | Average CTR | Good CTR | Primary Purpose | Why CTR Differs |
|---|---|---|---|---|
| Search Network | 3.17% | 4–6% | Demand capture | User is actively searching for your product |
| Display Network | 0.46% | 0.5–1.0% | Awareness + retargeting | Ad interrupts browsing behavior |
| YouTube (In-Stream) | 0.65% | 0.8–1.5% | Brand awareness | Video skippable after 5 seconds |
| Shopping Ads | 2.5% | 3–5% | Product discovery | Visual product cards with pricing |
| Performance Max | Varies | N/A | Multi-channel | CTR not reported at channel level |
The key takeaway: Never judge Display or YouTube performance by Search CTR standards. A 0.7% Display CTR is excellent. A 0.7% Search CTR is a crisis. The formats serve different stages of the buyer journey, and CTR is only meaningful within the context of that stage.
If your Display CTR is below 0.3%, the issue is likely creative quality or audience targeting — not the format itself. If your Search CTR is below 2%, the issue is almost always keyword relevance or ad position.
5 Factors That Actually Determine Your CTR (Beyond “Write Better Headlines”)
Every CTR optimization article tells you to “write compelling headlines.” That’s table stakes, not a strategy. Here are the five factors that actually move the needle on Google Ads CTR optimization, ranked by impact.
1. Ad position (Impact: Highest)
The single biggest CTR driver is where your ad appears on the page. Position 1 averages 6–8% CTR. Position 4 averages 1.5–2.5%. You can have the best ad copy in your industry and still get a 2% CTR if you’re consistently outranked by competitors with higher Ad Rank. Check your Auction Insights report to see your impression share and average position.
2. Keyword-to-ad relevance (Impact: High)
When a user searches “emergency plumber Dallas” and your headline reads “Best Plumbing Services in the DFW Area,” the mismatch is subtle but measurable. Ads that include the exact search query in the headline consistently outperform generic headlines by 30–50% on CTR. Use responsive search ads and pin your most relevant keyword variants into headline position 1.
3. Ad extensions (Impact: High)
Sitelink extensions, callout extensions, structured snippets, and call extensions increase your ad’s physical real estate on the search results page by 30–50%. More real estate means more visual prominence, which means higher CTR. Accounts using four or more extension types average 15–20% higher CTR than accounts using none.
4. Negative keyword hygiene (Impact: Medium-High)
Every irrelevant impression dilutes your CTR. If your ad for “luxury kitchen remodeling” is showing for “kitchen remodel DIY” and “cheap kitchen cabinets,” those impressions will never convert to clicks and your CTR drops. Aggressive negative keyword management is the fastest CTR improvement lever most advertisers ignore.
5. Audience targeting precision (Impact: Medium)
Layering in-market and custom intent audiences onto your Search campaigns allows you to bid more aggressively on users who are actively researching your product category. Higher bids win higher positions, and higher positions drive higher CTR. The audience layer itself doesn’t directly increase CTR — it increases your competitiveness in the auctions that matter.
How to Improve Your Google Ads CTR in 14 Days
If your CTR is below your industry benchmark, here’s a 14-day sprint to improve your Google Ads click through rate with specific daily actions.
Days 1–3: Audit and clean.
Pull your search terms report for the last 90 days. Add every irrelevant query as a negative keyword. This alone typically improves CTR by 10–20% within a week by eliminating impressions from unqualified searchers.
Days 4–6: Restructure ad groups.
Break any ad group with more than 15 keywords into smaller, tightly themed groups. Each ad group should contain 5–10 keywords that can all be served by a single, highly relevant ad. The tighter the theme, the higher the keyword-to-ad relevance, the higher the CTR.
Days 7–9: Rewrite responsive search ads.
Fill all 15 headline slots and 4 description slots. Pin your primary keyword into headline position 1. Include a specific offer or differentiator in headline position 2 (“Free Same-Day Estimates,” “500+ Five-Star Reviews”). Use headline position 3 for a call-to-action.
Days 10–11: Add every available extension.
Sitelinks (minimum 4), callouts (minimum 4), structured snippets (1–2), call extension, and location extension if you have a physical address. Each extension type adds visual weight to your ad and pushes competitors further down the page.
Days 12–14: Adjust bids for top-performing segments.
Review your device, time-of-day, and audience performance data. Increase bids 15–20% on segments with above-average CTR and decrease bids on segments dragging your average down. This doesn’t improve your ad quality — it improves your ad position in the auctions you’re most likely to win.
[IMAGE: Before-and-after Google Ads dashboard showing CTR improvement from 2.1% to 4.3% over a 14-day optimization sprint | Suggested alt text: “Google Ads CTR improvement dashboard showing increase from 2.1% to 4.3% after 14-day optimization” | Placement: above this paragraph]
If your CTR is still below your industry benchmark after running this 14-day sprint, the problem may not be your ad quality — it may be your keyword selection or auction competitiveness. At that point, it’s worth checking why your Google Ads aren’t getting impressions to diagnose whether you’re even entering the right auctions.
What Is a Good CTR for Google Ads on Mobile vs. Desktop?
Device context matters more than most advertisers realize. Mobile and desktop users behave fundamentally differently on the search results page, and their CTR patterns reflect that.
Mobile Search CTR averages 4–6% for position 1 — significantly higher than desktop. The reason is simple: mobile screens show fewer organic results above the fold, so ads occupy a larger percentage of the visible screen. A top-position mobile ad can capture 30–40% of all clicks on the page.
Desktop Search CTR averages 3–5% for position 1 — lower than mobile because desktop screens display more organic results, knowledge panels, and featured snippets that compete for attention alongside your ad.
The practical implication: If your mobile CTR is below 3%, your ads are likely appearing in positions 3–4 or lower, where the mobile CTR drops to 1–2%. If your desktop CTR is below 2%, the same positioning issue applies, compounded by the greater organic competition on larger screens.
The optimization move: Set device-level bid adjustments. If your mobile CTR and conversion rate are both higher than desktop (which is true for most local service businesses), increase your mobile bid adjustment by 15–25% to win more top-position mobile auctions.
The Quality Score Connection — How CTR Directly Impacts Your CPC
Here’s the financial reason CTR matters beyond vanity metrics. Your CTR is the single largest component of your Quality Score, and your Quality Score directly determines how much you pay per click.
The Quality Score formula (simplified):
- Expected CTR: ~50% weight
- Ad Relevance: ~25% weight
- Landing Page Experience: ~25% weight
A Quality Score of 10/10 can reduce your actual CPC by 30–50% compared to the auction’s minimum bid. A Quality Score of 3/10 can increase your CPC by 25–40% above the minimum. The difference between a 5% CTR and a 2% CTR on the same keyword can be $2–$4 per click in actual cost — which compounds to thousands of dollars per month at scale.
Real example: Two advertisers bidding on “HVAC repair near me” with a $10 max CPC. Advertiser A has a 6% CTR and a Quality Score of 8/10. Their actual CPC is $6.20. Advertiser B has a 2% CTR and a Quality Score of 4/10. Their actual CPC is $9.80. They’re competing in the same auction, but Advertiser B is paying 58% more per click because their low CTR signals to Google that their ad is less relevant to searchers.
CTR isn’t just a performance metric. It’s a pricing mechanism. Improving your CTR doesn’t just get you more clicks — it makes every click cheaper.
Google Ads Quality Score factors documentation
Real Campaign Teardown — How We Doubled CTR Without Rewriting a Single Ad
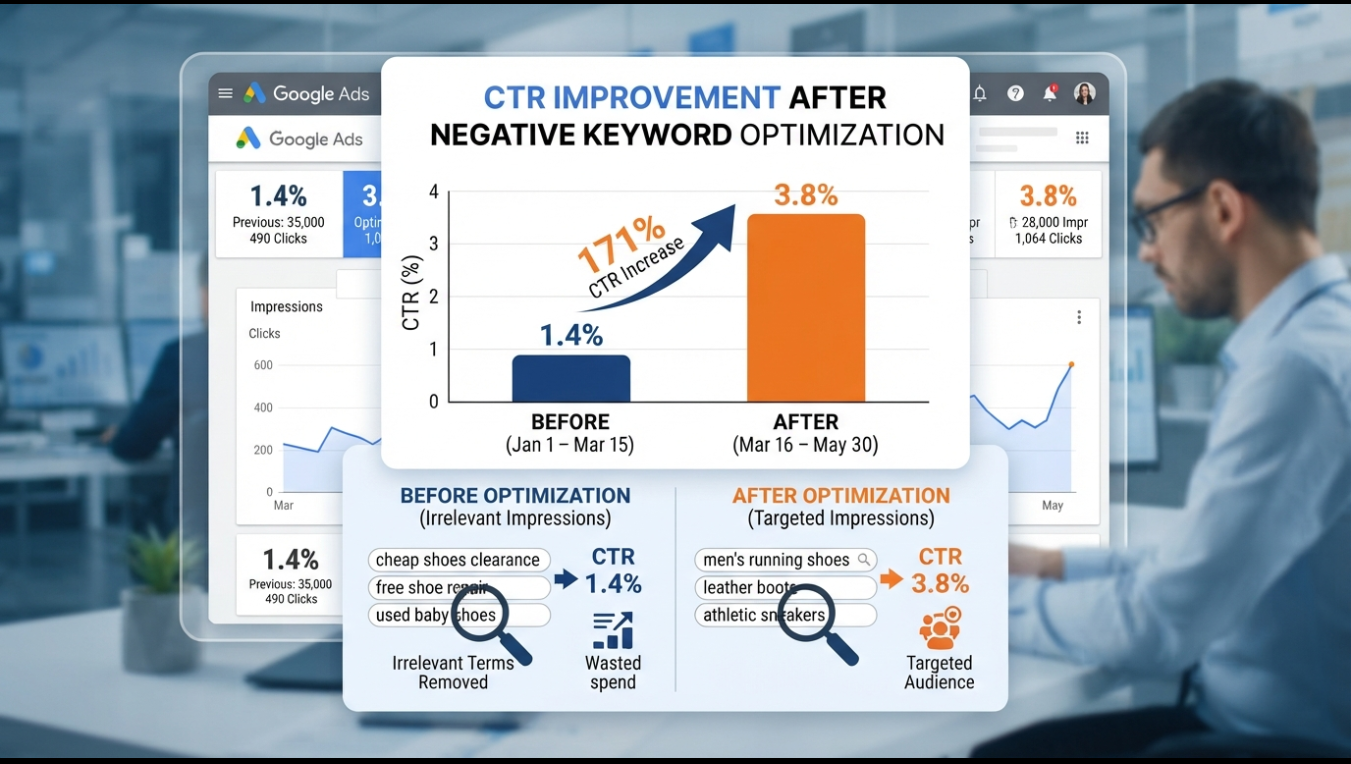
A B2B consulting firm came to me with a Search campaign averaging 1.4% CTR across 45 keywords. Their ad copy was solid — clear value proposition, specific differentiators, strong CTAs. Rewriting headlines wasn’t going to move the needle.
The diagnostic revealed the real problem: 60% of their impressions were coming from broad match keywords triggering for informational queries like “what is management consulting” and “how to become a consultant.” These searchers were students and career-changers, not business owners looking to hire a consulting firm. The ad copy was fine. The audience was wrong.
The fix took three steps:
- Added 200+ negative keywords from the search terms report, eliminating all informational and career-related queries. Impressions dropped 40% overnight.
- Switched remaining broad match keywords to phrase match, further tightening the eligible search pool to commercial-intent queries.
- Added audience layer targeting for “in-market for business services” and “company size 50–500 employees,” increasing bids 20% on qualified segments.
Results after 30 days:
- CTR increased from 1.4% to 3.8% (171% improvement)
- Impressions decreased from 45,000 to 18,000 (60% reduction)
- Clicks increased from 630 to 684 (8% increase despite fewer impressions)
- Conversions increased from 12 to 31 (158% increase)
- CPA dropped from $416 to $161 (61% reduction)
The ad copy never changed. The CTR doubled because we stopped showing the ad to people who would never click it. CTR optimization is more about eliminating bad impressions than generating good clicks.
Frequently Asked Questions About Google Ads CTR
What is the average CTR for Google Ads?
The average CTR for Google Ads across all industries is 3.17% on the Search Network and 0.46% on the Display Network. However, this aggregate number is misleading because CTR varies dramatically by industry — legal averages 6.5% while e-commerce averages 2.1%. Always compare your CTR against your specific industry benchmark, not the cross-industry average.
Is a 2% CTR good for Google Ads?
A 2% CTR is below average for Google Search Ads overall (3.17%) but may be perfectly acceptable in low-CTR industries like e-commerce (2.1% average) or B2B technology (2.4% average). More importantly, a 2% CTR with a 10% conversion rate generates significantly more revenue than a 6% CTR with a 1% conversion rate. Context and downstream metrics matter more than the raw CTR number.
How can I improve my CTR on Google Ads?
The fastest ways to improve your Google Ads CTR are adding negative keywords to eliminate irrelevant impressions, using responsive search ads with all 15 headline slots filled, including the target keyword in headline position 1, adding sitelink and callout extensions to increase ad real estate, and tightening ad group themes so each ad matches its keywords precisely.
What is a good CTR for Google Display Ads?
A good CTR for Google Display Ads is 0.5–1.0%, with the cross-industry average sitting at 0.46%. Display CTR is fundamentally lower than Search CTR because users aren’t actively searching for your product — they’re browsing websites and your ad is an interruption. Never judge Display campaign performance by Search CTR benchmarks.
Stop Chasing CTR and Start Measuring Profit Per Impression
A good CTR for Google Ads is 3–5% on Search, 0.5–1.0% on Display, and 0.8–1.5% on YouTube. If you’re hitting those numbers within your industry, your ads are performing well. If you’re below them, run the 14-day optimization sprint outlined above and focus on eliminating irrelevant impressions before you rewrite a single headline.
But the real takeaway from this article isn’t a benchmark number. It’s a shift in how you evaluate ad performance. CTR tells you whether your ad is interesting. Conversion rate tells you whether your ad is profitable. The two metrics are not correlated, and optimizing for one at the expense of the other is the most common budget killer in small business PPC.
Start measuring profit per impression. Multiply your CTR × conversion rate × average order value, then subtract your cost per impression. If that number is positive and growing, your CTR is exactly where it needs to be — regardless of what any industry benchmark says.
If you’ve made it this far, you already understand CTR better than most people managing six-figure ad budgets — because you now understand that CTR is a means to an end, not the end itself. So here’s the real question: have you calculated your profit per impression yet?
If yes, you know exactly which campaigns to scale and which to kill. If no, pull your last 90 days of data and run the math this afternoon. Bookmark this page for your next quarterly performance review, share it with whoever manages your campaigns, and read our guide on how much to spend on Google Ads per month to make sure your budget is aligned with the performance you’re actually getting.
